Delphia 500
A portfolio designed to outperform the S&P 500

Overview
Delphia lowers the barrier to premium investing by giving every day investors access to actively managed, AI-driven investment strategies. The Flagship portfolio made premium investing accessible without the need for accreditation, a high net worth, or a high investment minimum.
Delphia 500 was launched in November 2022. This was the newest actively managed investment strategy designed to annually outperform the S&P 500 by 1.5%. The new strategy would look to improve upon the S&P 500’s returns by leveraging the proprietary algorithm to improve its alpha.
Product Design Lead
Invest Team: Shawn Kumar, Senior Product Manager & Kevin Yuen, Technical Lead
Duration: September to October 2022 (2 months)
Responsibilities: Discovery, user research, UX design, interaction design, information architecture, product vision and strategy, QA testing.
Problems
In 2022, Flagship outperformed its benchmark, the Russell 3000, by 2.53%. However, during the downturn in the overall stock market, users interpreted that Flagship underperformed.
The portfolios invested into hundreds of stocks, however in the app, investors could only view the summary of the entire portfolio’s performance. Users felt like they only had a high-level overview of their portfolio.
The original design aimed for minimalism to prevent users from feeling overwhelmed, however our information-hungry users felt like we were not providing sufficient data to satisfy them.
Due to the over-simplification in the app, users misinterpreted data, made incorrect assumptions, and used external apps to satisfy their needs.

Flagship vs. Russell 3000 benchmark historical performance
August 2021 to August 2022
How users viewed and assessed performance
Users’ mental models around “beating the benchmark” meant beating the S&P 500.
New users navigated between multiple apps to compare their performance in Flagship against the S&P 500 to determine whether or not they would continue to invest more funds.
What problem does this behaviour create?
When new users assess the short-term performance data against a different benchmark, the results varied greatly.
Flagship consists of stocks from the Russell 3000 universe. When viewed in comparison to the performance of the S&P 500, short-term data varied because new users did not have enough data to accurately assess the long-term performance of the strategy.
A look at the original UI design
Only showed absolute returns
Did not support the ability to compare performance in-app
Did not support the ability to view the portfolio allocations
Only able to view the top 15 securities
Did not support the ability to see the stock performance name

From insights to opportunities
These findings led the leadership and asset management teams to develop a new investment strategy, the Delphia 500. This strategy would benchmark against the S&P 500 and continue to leverage the asset management team and proprietary algorithm.
On the product team, we used the findings to identify opportunities to improve the monitoring and exploration activities in the investment experience that paired with the launch of the new portfolio.
Laying the foundation with information architecture
As part of our discovery work, we explored how we might improve the investment experience for the Delphia 500. The portfolio was being offered as a premium product and we wanted a tailored experience that showcased the new strategy.
How might we help investors explore and understand the performance of their portfolio?
Users wanted insight into what securities we invested in from the S&P 500 universe.
When users are monitoring their investments, their primary concern is their absolute returns. Comparing portfolios is secondary and less frequent.
Avoid jargon – technical language made the experience unnecessarily confusing and complicated.
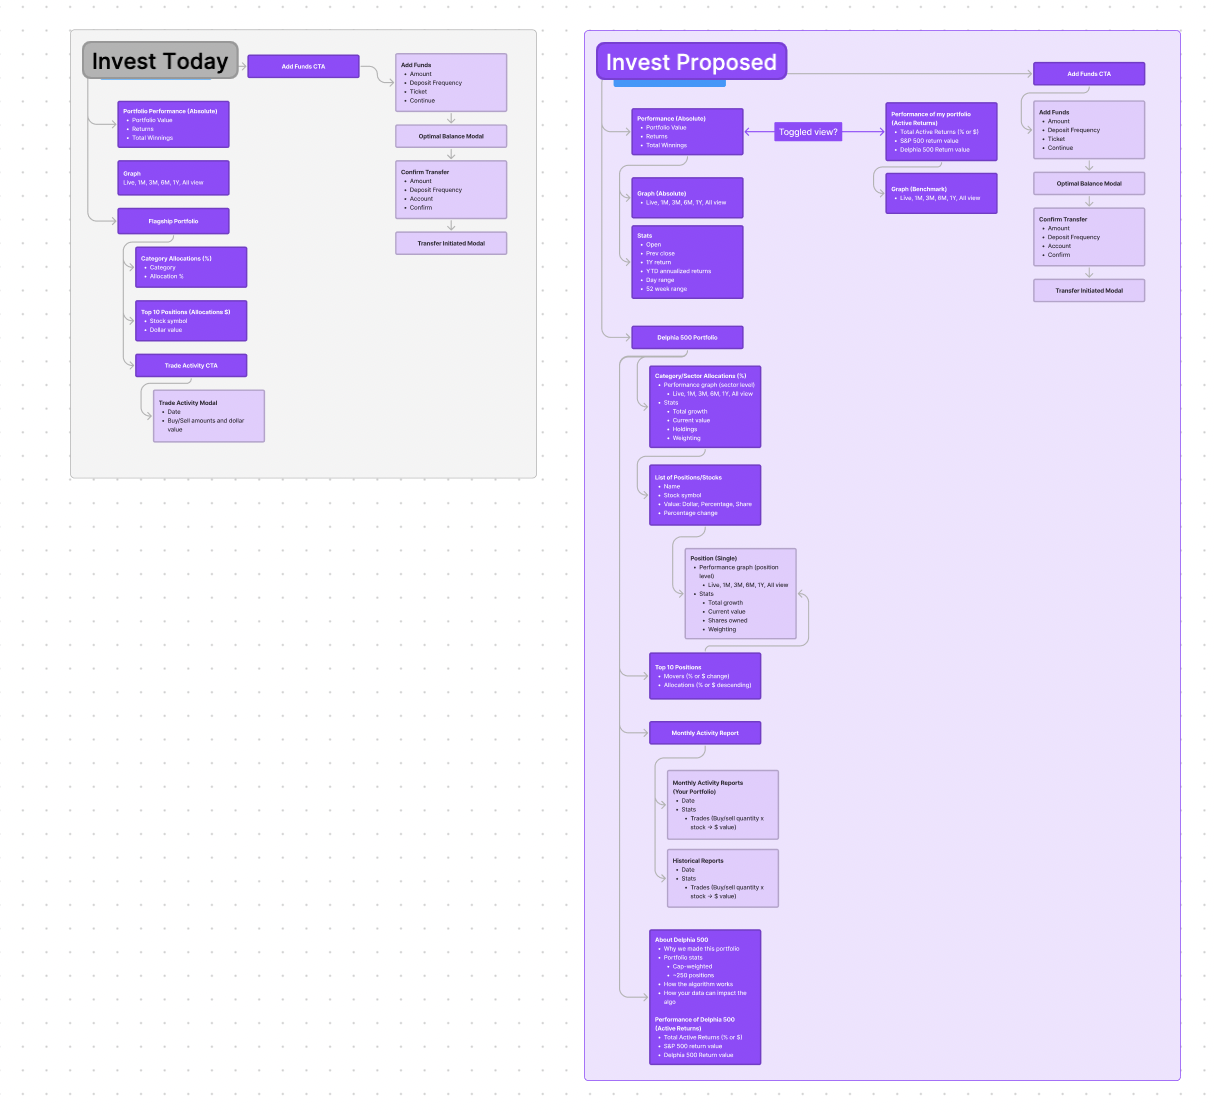

Supporting the ability to compare
To better serve users who were actively comparing the performance of their portfolio against a benchmark, I designed concepts for a comparison view in-app. The new experience supports the ability to toggle between their absolute returns (the total gains or losses on their investment) and their benchmark comparison.
Comprehension and usability
Benchmarking and active returns are investment concepts that are new to most every day investors due to being exclusively used in managed portfolios.
I ran 8 moderated concept tests to validate the experience was comprehensible and met the needs of our target user.
These tests gave me insight and context into how users monitor their investments, the type of information they may need, and their interpretation of the graphs. These findings informed the interactions and content labelling used for this new feature.


An iterative strategy
Working in an early stage start-up meant that we did not have a large team who was able to execute launching both a large-scale new feature and the addition of a new portfolio strategy. I worked with the development team to strategically and iteratively ship the new portfolio and invest experience.
Phase 1: Portfolio-Only Beta Release
Phase 2: Benchmarking Single View MVP
Phase 3: Benchmarking Comparison View
Phase 4: Benchmarking in Intraday
Phase 5: Legacy user migration
Phase 6: GA

Vision discovery through user interviews
The Investment Experience team did not previously have leads to inform their work for the quarter and the team of software engineers worked primarily on “Keep the Lights On” work. With the formation of our product triad, we wanted ensure that we had a clear picture on user needs so we could develop a customer-centric prioritized roadmap to guide the team.
I lead the research strategy for discovery on the Invest product and facilitated user interviews with our customers.
As part of this work, I developed:
Research plans and objectives
Discussion guides
Automated recruitment process


Voice of the customer
I collected and aggregated data from our multi channel customer touchpoints. The purpose of the aggregation was to begin developing a strong VoC to inform product decisions across the organization. We used the following methods of data collection and I gathered the feedback from those channels and used Dovetail for analysis.
User interviews
Product satisfaction survey
Customer support requests
Discord
Sharing the insights
As an output of the findings, I developed quarterly insight reports that highlighted the key pain points and opportunity areas. These insights would later inform the vision and roadmap for the Investment Experience team.

Thinking beyond about investing
As we began to explore how we might improve the investment experience, I interviewed current users and ran card sorting sessions to inform our navigation.
How our users expect to consume information
Details about the make-up of the portfolio should be easily accessible.
Monitoring and exploring the investment portfolio is valued and it’s best served by supporting the ability to “go deeper” into each level of detail, from portfolio to sectors to security.
Our information-hungry customers are not satisfied by the simplicity and lack of information we offer today.
Users are using third-party platforms to fill knowledge gaps.

An exploration on the future state of investing
Taking the pain points and desires learned from the Voice of the Customer, I began exploring the future state of the investment experience in partnership with our Senior Product Manager. We worked to develop a prioritized list of objectives and goals and product opportunities which would inform our roadmap.
Key areas of focus
Core Investing Experience: Creating a best-in-class investing experience for investors so they feel confident using Delphia for the long term.
Transparency & Trust: Making the investing experience transparent and understandable so investors confidently trust us.
Choice & Ownership: Offering more choice to investors so they can feel a sense of ownership in what they are invested in.
Community: Building a community so investors feel involved and engaged with Delphia and the larger collective.
Ecosystem: Creating an ecosystem between investing and data contributions so investors can see the impact that collective data has on their investments.

Opportunities
A revised information architecture that allows users to view their portfolio at different levels, an overview, sector view, and single stock view.
Supporting the ability to select your personal values and receive portfolio suggestions that are aligned to you.
Contextual education and information about investing throughout the customer journey.